India’s IT services landscape is dominated by two stalwarts — Tata Consultancy Services (TCS) and Infosys. These global technology powerhouses are central to India's software export story, competing not just locally but also on the world stage. This in-depth comparison covers financials, operational performance, employee data, client mix, innovation metrics, and much more.
Table of Contents
- Company Overview
- Financial Snapshot (as of Mar 2025)
- Revenue by Business Segment (FY25)
- Geographic Revenue Mix
- Client Metrics
- Innovation & R&D
- Quarterly Performance (Q4 FY25)
- Cash Flow & Balance Sheet Health
- Long-Term Growth Metrics
- Shareholding Pattern (Mar 2025)
- SWOT Summary
- Final Verdict: Which One to Pick?
- FAQs
This analysis provides a concise comparison between two prominent Indian IT companies: Tata Consultancy Services (TCS) and Infosys. We will explore their foundational characteristics, operational scale, and a recent financial snapshot as of March 2025. By examining key metrics, we aim to shed light on their individual strengths and positions within the dynamic technology services industry.
/content-assets/09b2dc4adebe47229df5b4b4babef1de.png)
Insight: TCS has nearly double the workforce of Infosys, but Infosys has a slightly higher women's participation rate.
If you're keen on tracking TCS's stock movements, financial ratios, and corporate actions, check the TCS share price, complete company fundamentals and historical charts.
India’s leading IT majors, TCS and Infosys, continue to command strong positions in the technology services sector. Their FY25 financial results reflect operational resilience, profitability, and steady shareholder payouts. While TCS leads in market cap, profitability, and returns, Infosys offers a relatively higher dividend yield. Here’s a snapshot comparing their key financial metrics as of March 2025.
|
Metric
|
TCS
|
Infosys
|
|
Market Cap
|
₹12.48 Lakh Cr
|
₹6.70 Lakh Cr
|
|
Revenue
|
₹2,55,324 Cr
|
₹1,62,990 Cr
|
|
Net Profit
|
₹48,797 Cr
|
₹26750 Cr
|
|
Stock Price
|
₹3,450
|
₹1,620
|
|
EPS
|
₹134.2
|
₹64
|
|
Dividend Yield
|
1.73%
|
2.66%
|
|
ROCE
|
64.6%
|
37.5%
|
|
ROE
|
52.4%
|
28.8%
|
|
Debt to Equity
|
0.10
|
0.09
|
Wrap-Up: TCS leads across key financial metrics, while Infosys offers a stronger dividend yield for investors.
Check the current Infosys share price, financials, shareholding pattern, and ratios directly on the stock page to evaluate its fundamentals beyond just price trends.
TCS and Infosys derive the bulk of their revenue from the Banking, Financial Services & Insurance (BFSI) sector. While TCS holds a higher share in BFSI, it also enjoys a more diversified business mix across verticals. Infosys, meanwhile, remains relatively concentrated in select sectors like Manufacturing and Energy. This segmentation highlights differing strategic focuses within India’s top IT players.
/content-assets/4313b534605949b58ce27628e1d75fb0.png)
Wrap-Up:
Both firms are BFSI-centric, with TCS enjoying a more balanced industry spread than Infosys.
Geographic diversification plays a crucial role in the revenue stability of IT services firms. TCS maintains a wider international spread, with significant contributions from Europe, India, and other regions. In contrast, Infosys relies heavily on North America, reflecting a narrower market concentration. This mix reveals contrasting global strategies between the two industry leaders.
|
Geography
|
TCS
|
Infosys
|
|
North America
|
48.2%
|
57.9%
|
|
Europe
|
31.1%
|
29.8%
|
|
India
|
8.6%
|
3.1%
|
|
Rest of World
|
12.1%
|
9.2%
|
Wrap-Up: Infosys is more U.S.-centric, while TCS benefits from broader geographic diversification.
Client metrics reflect the strength and depth of an IT services firm’s business relationships. TCS leads in large-ticket clients, with more accounts contributing over US$100M and US$50M annually. Infosys, however, maintains a larger total client base but with higher revenue concentration among its top clients. These dynamics indicate different client engagement and revenue risk profiles.
|
Clients
|
TCS
|
Infosys
|
|
US$100M+
|
64
|
39
|
|
US$50M+
|
130
|
85
|
|
US$10M+
|
298
|
309
|
Wrap-Up: TCS commands more large-value clients, while Infosys faces higher client concentration risk.
Innovation and R&D investments are crucial for IT firms to stay ahead in a rapidly evolving tech landscape. TCS leads significantly in both R&D spending and cumulative patents filed and granted. While TCS focuses on cognitive computing, GenAI, IoT, and blockchain, Infosys sharpens its AI and cloud offerings through platforms like Topaz and Cobalt. Both firms remain committed to strengthening future-ready digital capabilities.
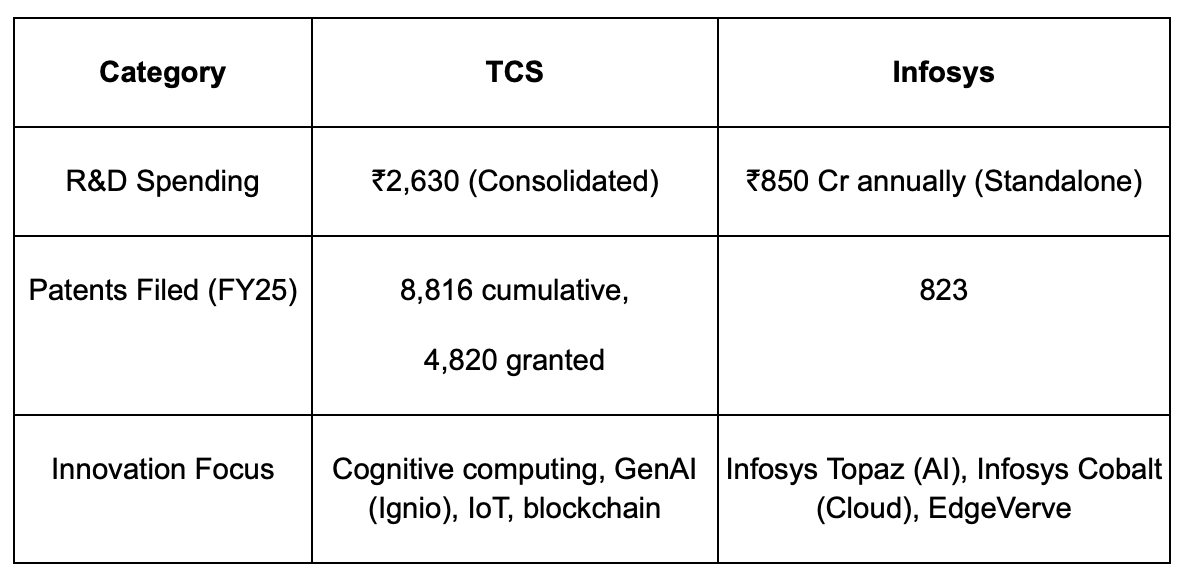
Wrap-Up: TCS outpaces Infosys in R&D investments and patent filings, reinforcing its tech leadership position.
The Q4 FY25 results reflect contrasting quarterly trends for TCS and Infosys. While TCS posted steady revenue growth with a marginal dip in profit, Infosys delivered stronger revenue growth but faced a sharper profit decline. TCS’s stable performance highlights operational consistency, whereas Infosys’s mixed numbers suggest margin pressure. These quarterly shifts underline the importance of cost management amid growth.
|
Metric
|
TCS
|
Infosys
|
|
Quarterly Revenue
|
₹64,479 Cr
|
₹40,925 Cr
|
|
Net Profit
|
₹12,293 Cr
|
₹7,038 Cr
|
|
QoQ Revenue Growth
|
0.8%
|
7.9%
|
|
QoQ Profit Growth
|
-1.7%
|
-11.7%
|
Wrap-up: TCS held steady with consistent margins, while Infosys chased growth at the cost of profitability.
Want to see how these corporate actions have translated into long-term gains? Here's a decade-long performance analysis of TCS share price history and investor returns to help you evaluate the actual impact.
A company’s cash flow and balance sheet strength indicate its ability to fund operations, investments, and shareholder returns. In FY25, both TCS and Infosys showcased solid operating cash flows, with TCS generating a higher figure. Infosys, however, maintained a larger cash reserve, offering greater liquidity flexibility. Borrowings remained minimal for both, reflecting prudent financial discipline.
|
Metric
|
TCS
|
Infosys
|
|
Operating Cash Flow
|
₹48,908 Cr
|
₹35,694 Cr
|
|
Cash & Equivalents
|
₹15,463 Cr
|
₹24,455 Cr
|
|
Borrowings
|
₹9,392
|
8,227
|
Wrap-Up: TCS stayed steady in Q4, while Infosys saw higher revenue growth but sharper profit erosion.
Consistent dividend payouts are equally remarkable. For a comprehensive view, check out this detailed breakdown of TCS dividend history and payout trends.
A healthy cash flow and balance sheet are vital indicators of a company’s financial resilience and operational strength. In FY25, both TCS and Infosys reported strong operating cash flows, though TCS maintained a higher free cash generation. Infosys held a larger cash reserve, providing liquidity flexibility, while TCS kept borrowings minimal. This balance underscores prudent financial management at both firms.
|
Metric (CAGR)
|
TCS
|
Infosys
|
|
5-Year Revenue
|
10.2%
|
12.4%
|
|
5-Year Profit
|
8.4%
|
9.9%
|
|
5-Year ROE
|
46.7%
|
30.21%
|
|
5-Years Stock
|
9%
|
15%
|
|
3-Year Stock
|
3%
|
3.5%
|
Wrap-up: TCS shows superior capital efficiency, while Infosys edges ahead on growth and market returns.
The shareholding structure of a company reflects its ownership stability and market positioning. TCS remains heavily promoter-driven, with Tata Sons holding a dominant 71.77% stake. In contrast, Infosys has a more diversified institutional holding, with DIIs and FIIs collectively owning over 71%. This distinction marks TCS as a promoter-led firm and Infosys as a market-owned enterprise.
|
Category
|
TCS
|
Infosys
|
|
Promoters
|
71.77%
(Tata Sons)
|
14.60%
|
|
FIIs
|
12.04%
|
32.89%
|
|
DIIs
|
11.55%
|
38.32%
|
|
Public
|
4.64%
|
13.72%
|
Wrap-Up: TCS is promoter-heavy, while Infosys enjoys broader institutional and public ownership.
A SWOT analysis helps evaluate a company’s strategic position by identifying its internal strengths and weaknesses. TCS maintains clear leadership with scale, profitability, innovation, and lower client risk, though it faces slower growth and higher valuations. Infosys impresses with faster growth, U.S. market strength, and digital solutions, but contends with margin pressure and concentrated revenues. This comparison highlights contrasting risk-return trade-offs for investors.
TCS Strengths
- Largest IT firm in India by revenue and market cap
- Superior ROE/ROCE and margins
- Strong innovation engine (Ignio, Cognix, AI/ML)
- Lower client concentration risk
- Consistent dividend and payout history
TCS Weaknesses
- Slower top-line growth (10% CAGR)
- Higher valuation multiples
- Limited stock returns over 3 years
Infosys Strengths
- Higher U.S. market penetration
- Better 3-year stock performance
- Slightly higher dividend yield
- Faster revenue CAGR in recent quarters
- Strong digital product suite (Cobalt, Topaz)
Infosys Weaknesses
- Margin pressure and declining net profits
- Higher revenue dependency on top clients
- Less diversified geographically
Wrap-Up: TCS offers stability with scale, while Infosys delivers growth with higher business concentration risks.
If you’re looking to understand the stock fundamental analysis of TCS and Infosys in detail, Groww has all the details in this video. Highly recommend you watch it!
Choosing between TCS and Infosys depends on an investor’s preference for stability versus growth. TCS leads in profitability, innovation, and overall business stability with consistent returns and lower risk. Infosys appeals to growth-focused and income-seeking investors with faster revenue expansion and a better dividend yield. This head-to-head comparison highlights each firm’s distinct investment proposition.
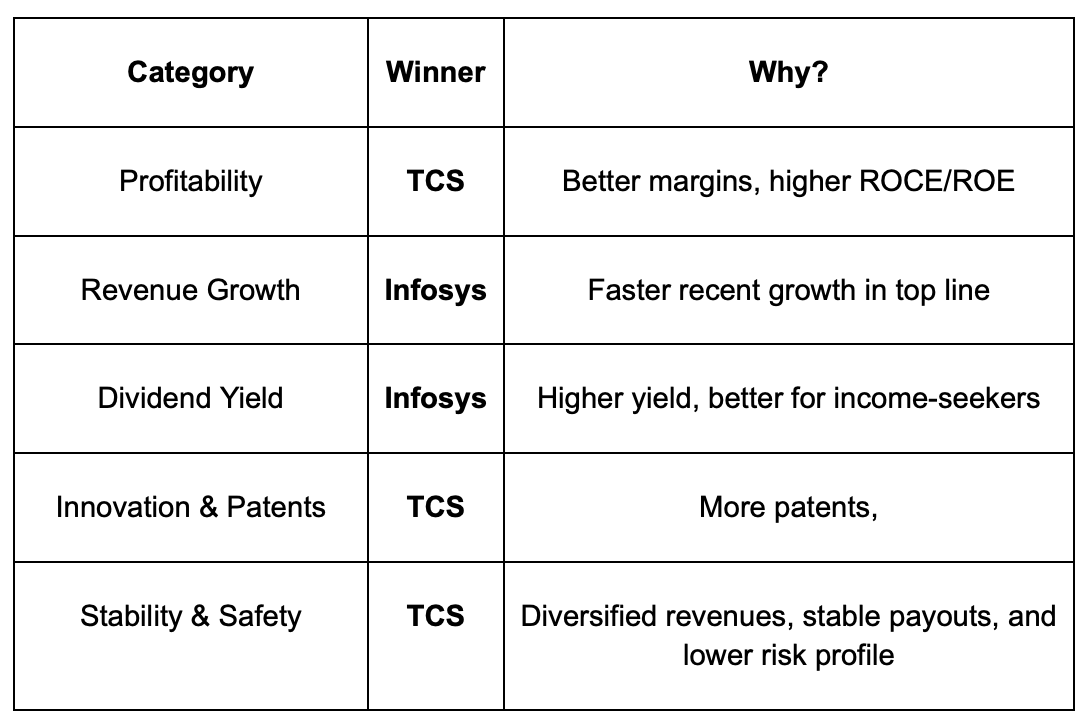
TCS is the blue-chip champion—ideal for investors seeking scale, stability, and strong profitability.
Infosys offers a high-growth, high-yield alternative, excelling in digital transformation and return metrics.
- Which is better in 2025: TCS or Infosys?
In 2025, TCS leads in profitability, margins, and innovation, while Infosys offers faster recent revenue growth and a higher dividend yield. TCS is ideal for stability seekers; Infosys suits growth-oriented investors.
- Who has higher revenue in FY2025 — TCS or Infosys?
TCS reported revenue of ₹2,55,324 crore in FY2025, significantly higher than Infosys’s ₹1,62,990 crore.
- What is the difference in client base between TCS and Infosys?
Infosys has 1,869 active clients, while TCS has a broader mix of large accounts with lower revenue concentration, making it less dependent on top clients compared to Infosys (whose top 10 clients contribute 19.9% of revenue).
- Which company invests more in R&D — TCS or Infosys?
TCS invests significantly more, spending ₹2,630 crore (consolidated), while Infosys spends ₹850 crore (standalone). TCS also leads in patents with 8,816 filed, compared to Infosys’s 823.
- How do TCS and Infosys differ in geographic revenue mix?
Infosys earns 57.9% from North America, showing high U.S. dependency. TCS has a more diversified global presence, with only 48.2% from North America and higher revenue from India and the rest of the world.
- Which has better long-term stock performance: Infosys or TCS?
Over the past 5 years, Infosys has outperformed with a 17.8% stock CAGR, compared to TCS’s 10.9%. However, TCS offers better consistency and financial fundamentals.
- What is the dividend yield for Infosys and TCS in 2025?
Infosys offers a higher dividend yield of 2.66%, while TCS yields 1.73%, making Infosys more attractive to income-focused investors.
- Is TCS or Infosys better for new investors in 2025?
TCS is a safer, blue-chip choice with strong fundamentals, while Infosys may appeal more to aggressive investors looking for growth and dividend income.